Governments and business around the world face growing expectations to deliver a net zero global carbon economy by 2050, in line with the 2015 Paris Agreement. Today, business analysts, investors, insurers and consumers not only expect to see a net zero commitment to reduce greenhouse gas emissions (GHG) by 2050, but also a deliberate, staged and defensible plan to deliver emissions reductions over time to achieve the 2050 goal.
In 2020, OceanaGold committed to achieving net zero greenhouse emissions by 2050. During 2021, operational and corporate sustainability teams worked together to identify specific actions to reduce emissions across the company – taking into account the projects already underway, emerging technologies and actions by governments to increase renewables in their power grids.
In February 2022, the OceanaGold Board approved an interim target to reduce carbon emissions per ounce of gold produced by 30 per cent by 2030 (based on 2019 performance levels). This interim climate change target is based on a clear action plan to help reach OceanaGold’s goal to net zero operational greenhouse emissions by 2050.
Decarbonisation in the mining industry
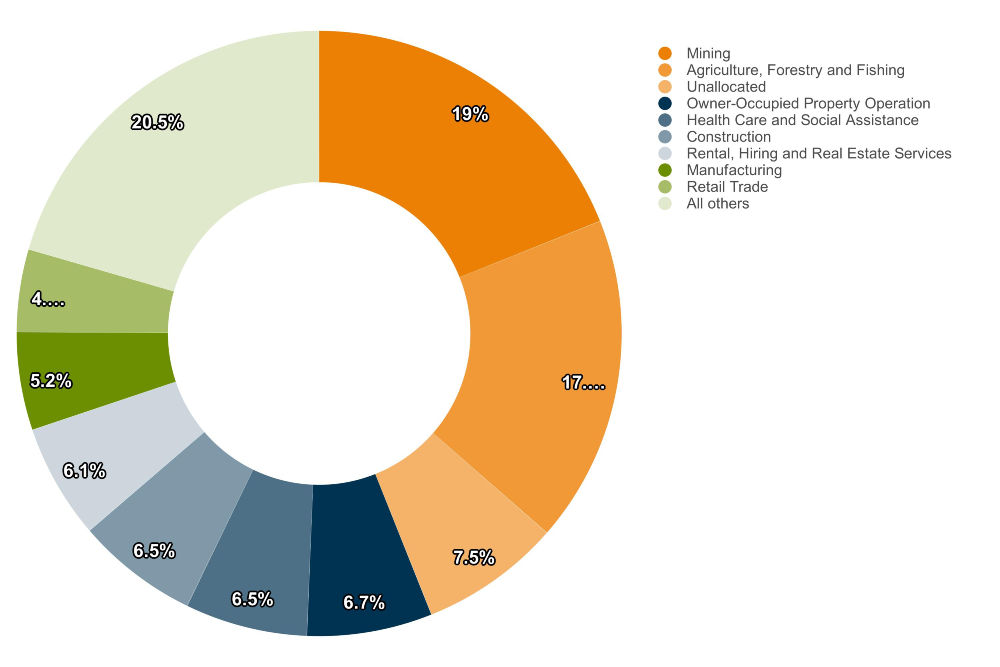
Decarbonisation is seen as a major disrupter in the mining and metals industry and according to Ernst and Young’s latest mining sector report (Top mining and metals risks and opportunities in 2022), it is in the top three business risks for 2022.
The World Gold Council (WGC) has recognised the need for strong action within the industry, identifying four key focus areas to manage greenhouse gas emissions – decarbonisation of mobile equipment fleet, decarbonisation of electricity supply, energy efficiency in the static plant, and carbon capture, sequestration, and offsets.
The company had developed an emissions reduction strategy to provide a pathway to maintain focus and build capability in emissions management across the organisation – with a focus on three of these areas; decarbonisation of the mobile equipment, increased use of renewable energy, and energy use/energy efficiency improvements.
A non-linear approach to net zero
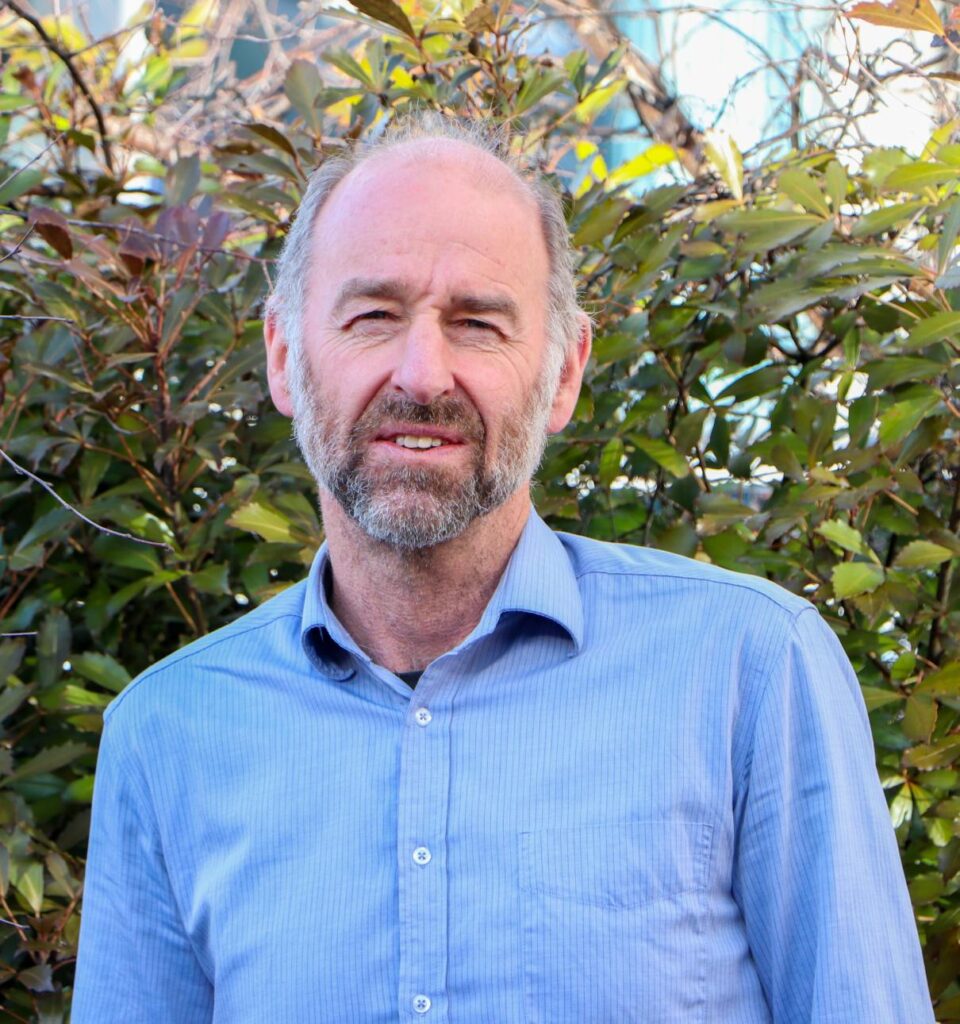
OceanaGold General Manager for Health, Safety and Environment, Greg Scanlan, said the 2030 target was determined following industry benchmarking, the establishment of an emissions intensity baseline, and identification of reduction opportunities at an operational level.
“The pathway to deliver the 2030 target will need to adapt given actual performance, increasing regulatory and market pressures, rapidly changing technology and as frameworks for measuring and reporting are adapted and developed,” Greg said.
“There is a long way to go to net zero and our journey won’t be linear. Our interim 2030 climate change targets will help drive focus and innovation across the company, meet our stakeholders’ expectations and set a challenging but achievable pathway in line with industry targets.”
“In 2019 (our baseline year), OceanaGold generated 0.52 tonnes of CO2e per ounce of gold produced, lower than the industry average of 0.8 tonnes of CO2e per ounce of gold produced, as reported by the World Gold Council.”
Technology and innovation key to decarbonisation
As a responsible miner, OceanaGold continuously improves and innovates the way it explores, extracts and processes minerals, drawing on the latest advanced technology and systems to improve performance.
Clear actions are required to reach decarbonisation and rapid advances in technology and innovation, including electrification, are central to the mining industry’s commitment to reducing its environmental impact.
“We are on an exciting journey of innovation and transformation in an industry which is vital to us all as we transition to a low-carbon world. Since 2018, OceanaGold has been implementing a company-wide program of automation, digital and process transformation, which is helping our company define the journey to operate the mines of the future,” Greg said.
In line with the interim 2030 target, OceanaGold has developed an internal reporting and visualisation tool (dashboard) that will improve tracking of its emissions in close to real time, support operational decision-making and maintain a focus on the performance of each operation.
Clear actions to reduce impact
“Our strategy supports an adaptive approach to driving emissions reduction by providing flexibility within the plan to respond to emergent opportunities, lessons learned at other sites, and evolving organisational priorities,” Greg said.
“The primary focus will be around decreasing the carbon intensity from our electricity suppliers, which is achievable through an increased focus on the purchase of renewable energy, through national government initiatives to encourage and mandate greening of grid electricity.”
The company will also be seeking to identify and accelerate decarbonising its mobile equipment fleet. Displacing or reducing diesel as the primary fuel for mining equipment, with a view to implement electrification and the use of alternative fuels such as biodiesel, hydrogen and emerging (hybrid) technology.
“OceanaGold will reduce energy use throughout its operation by reducing energy losses, using solar lighting wherever possible, and improving equipment use efficiency,” Greg said.
“By the end of June 2022 all operations will have completed negotiations with their current electricity supplier to maximise the renewable energy component of supply broadly consistent with current commercial costs.”


 The Lancaster Children’s Home affords a chance for the children to press “reset” since many have been abandoned, neglected, or abused in some way. State funding and grants provide only a portion of the funds required to operate the facility in a “home-like” way.